Orinda Downs' Median Price Looks Like It's Falling. The Sales Pace Says Otherwise.
September 10, 2026
September 10, 2026
If you've been tracking Orinda Downs from outside the market, you've probably run into a number that looks like a warning sign. In the three months ending July 2026, the neighborhood's median sale price came in at $2.33 million, down 23.1% from the same period a year earlier. That's the kind of drop that makes a buyer think they've found a soft spot in an otherwise expensive town.
Scroll to the next line on the same report and the story stops making sense. Homes in Orinda Downs are selling in an average of 7 days, one of the fastest paces of any named pocket in Orinda. A neighborhood that's genuinely losing value doesn't also clear its listings twice as fast as the citywide average. Something else is driving that 23% number, and it has more to do with how a median behaves in a small market than with what any specific house is actually worth right now.
That gap matters if you're cross-shopping Orinda Downs against Glorietta, Downtown Orinda, or Ivy Drive. The median is the number every portal leads with. It's also the number most likely to mislead you in a neighborhood this size.
Pull the trailing three-month data for Orinda's named micro-neighborhoods and you get a spread that shouldn't exist inside one 12.8-square-mile town if prices were moving together.
| Price (period ending ~July 2026) | Year-over-year change | Avg. days on market | |
|---|---|---|---|
| Orinda Downs | $2.33M median | -23.1% | 7 |
| Ivy Drive | $1.45M average | -13.7% | 7 |
| Glorietta | $3.69M average | +84.2% | — |
| Downtown Orinda | $1.8M median | +20.8% | 38 |
| Northeast Orinda | $2.3M median | +53.3% | 9 |
| North Orinda | $2.45M median | +32.4% | 19 |
| Orinda Oaks | $1.3M median | -17.2% | — |
| Northwest Orinda | $1.58M median | -32.8% | — |
| Tahos | $3.1M median | +42.4% | — |
Set that against the citywide figure: Orinda's median sale price over the same three-month window was $2.0 million, up 7.6% year over year, with homes selling in an average of 12 days, down from 21 a year earlier. Every one of the eight pockets above deviates from that citywide number by double digits in one direction or the other. Northwest Orinda is down almost a third. Glorietta is up nearly a third again in the other direction. If the city as a whole is up modestly, and its parts are swinging 30 to 80 points away from that in both directions, the parts are telling you more about sample size than about value.
Orinda Downs doesn't produce enough closings in a given quarter for a median to behave the way it does in a larger market. When only a handful of homes sell in three months, the median isn't measuring appreciation or depreciation. It's measuring which specific houses happened to close. If last year's window included one or two larger estate-scale sales and this year's window skewed toward smaller homes on smaller lots, the median can fall by double digits while every comparable property is worth the same or more than it was twelve months ago. Realtors call this a mix shift, and it's the single most common reason a hyper-local median swings hard from one quarter to the next without any real change underneath it.
Orinda Downs gives you the tell. Price per square foot over the same window was down only 5.1%, a fraction of the 23.1% median decline. If home values had genuinely eroded across the neighborhood, those two numbers would move together. They didn't. The gap between them is the signal that this is a sample problem, not a value problem.
Set the median aside and look at pace. Orinda Downs is clearing listings in 7 days on average, tied with Ivy Drive for the fastest turnaround among the pockets in this data set, and well ahead of the citywide average of 12 days. Compare that to Downtown Orinda, where the median is up 20.8% but homes take an average of 38 days to sell. A neighborhood posting a falling median and a 7-day sales pace at the same time isn't behaving like a market in retreat. It's behaving like a market where well-priced listings get absorbed before the price conversation gets interesting, which can push sellers toward conservative asking prices rather than testing the ceiling, and that conservatism shows up in the median even though it has nothing to do with what buyers are actually willing to pay.
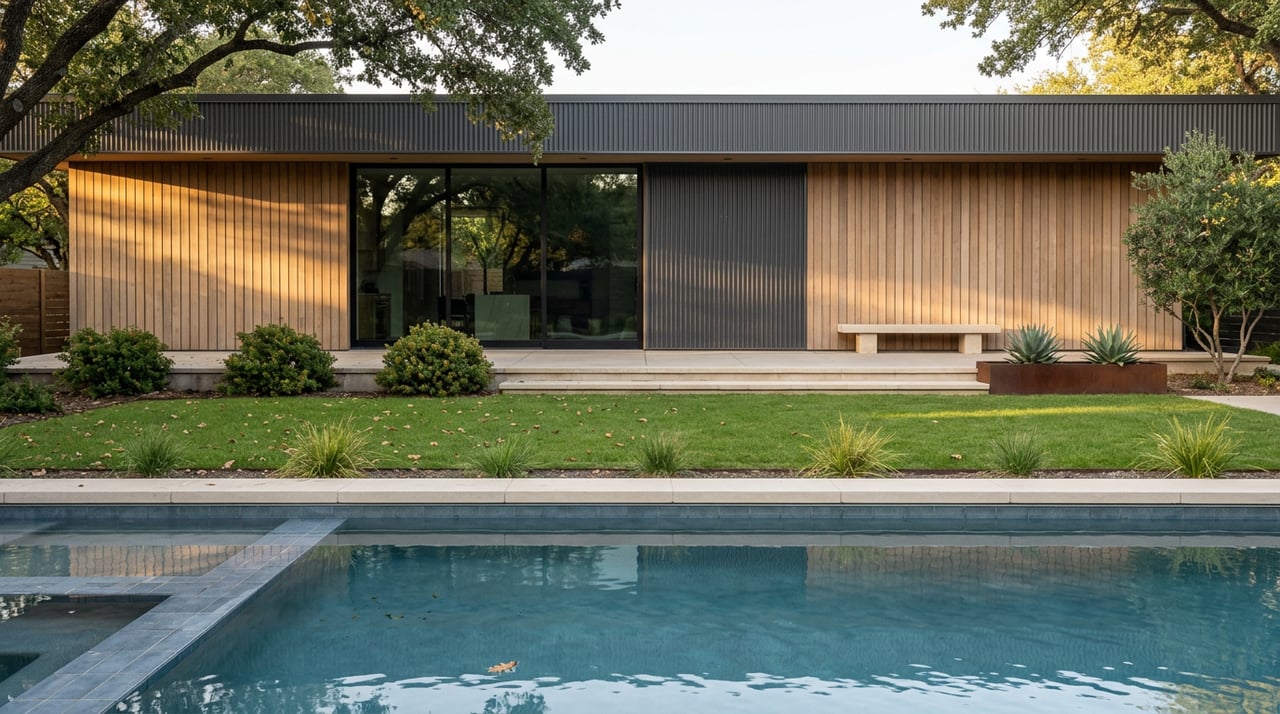
That fits what Orinda Downs is as a physical place. It sits in the same general swath as Sleepy Hollow and the Orinda Country Club area, a pocket known for larger parcels and a mix of flatter streets and hillside lots rather than the tighter, flatter grid you'll find closer to downtown. That's a market where a single estate-scale closing, or its absence, can move the median by hundreds of thousands of dollars without reflecting anything about the neighborhood's broader direction. The current citywide backdrop reinforces that this isn't a demand problem: an early September 2026 weekly market read for Orinda as a whole showed inventory tightening to 30 active listings and a rising market action index, both signs of a seller's market with upward pricing pressure if the trend holds.
Don't read Glorietta's 84.2% jump as proof that it gained value while Orinda Downs lost it. Read it as a signal that Glorietta had a run of larger closings in this particular window and Orinda Downs didn't, a pattern that can flip next quarter with no underlying change in either market. Price per square foot travels better across quarters in markets this thin, though even that number moves when a handful of estate-scale properties dominate the closings, as the 46.2% jump in Downtown Orinda's per-square-foot figure suggests happened there.
If you're weighing Orinda Downs against a neighboring pocket, ask for the actual closed comps on homes matching the size and lot type you want, rather than leaning on the headline median for the neighborhood as a whole. Days on market and sale-to-list ratio tell you more about real competitiveness in a small market than a median price that's one or two transactions away from moving 20 points in either direction.
Does a falling median mean I can offer under asking in Orinda Downs? Not based on what this data shows. A neighborhood selling in 7 days on average, tied for the fastest pace in Orinda, isn't one where a falling headline number translates into real negotiating room. The listings that sit are the exception, not the pattern.
Is Orinda Downs cheaper than Glorietta right now? On the median, yes, by a wide margin. But Glorietta's number is being pulled upward by an 84.2% swing that's just as likely a small-sample artifact as Orinda Downs' drop. Comparing the two headline medians tells you less than comparing recent closed sales for homes of similar size and lot type in each pocket.
How often does this kind of swing happen in Orinda's smaller neighborhoods? Often. The city sold 70 homes in July 2026. Spread across a dozen named micro-neighborhoods, most of them are working with a handful of closings per quarter, which is exactly the condition under which medians move without any real shift in value.
If you're trying to make sense of what a specific Orinda Downs property is actually worth, rather than what the last quarter's median suggests, that's a comps conversation, not a headline-number conversation. Alexis Thompson has spent close to two decades tracking these pockets street by street, and a free home valuation is the fastest way to see where your property or your target house actually sits against what's closed recently, not what a thin quarter of data happens to say.
Stay up to date on the latest real estate trends.

Etiam non quam lacus suspendisse faucibus interdum. Orci ac auctor augue mauris augue neque. Bibendum at varius vel pharetra. Viverra orci sagittis eu volutpat.