Sleepy Hollow Doesn't Have One Housing Market. It Has Two.
August 13, 2026
August 13, 2026
Two homes. Same neighborhood. Both built in 1952. Both in the mid three-thousand-square-foot range. Both closed within the same eight months.
181 Lombardy Lane sat on the market for 92 days before it sold for $3,250,000 in September 2025. Down the road, 65 Van Ripper Lane sold for $3,450,000 in March 2026 with zero days on market. Same era of construction, same neighborhood, same rough price bracket, and a gap of ninety-two days between how long it took to find a buyer.
If you've been reading the headline numbers on Sleepy Hollow, this probably surprises you. The neighborhood's median price has been reported up 21% over the trailing twelve months on one aggregator and up 33.9% over the three months ending May 2026 on Redfin, with homes reportedly going pending in an average of seven days. That's the number agents quote, the number that makes its way into market roundups, the number that sounds like a single, simple story: Sleepy Hollow is hot.
It is, for some houses. For others, it isn't close. And if you're comparing Sleepy Hollow to Orinda Downs, Wagner Ranch, or Happy Valley while shopping the Lamorinda corridor, the difference matters more than the headline.
Start with what's actually been reported. Redfin's data for the three months ending May 2026 puts Sleepy Hollow's median sale price at $3.4 million, up 33.9% year over year, with homes going pending in around 7 days and selling for roughly 11% above list on average. A separate aggregator's trailing twelve-month figure put the median closer to $3,030,000, up 21% year over year, then updated its own snapshot a month later to $3,125,000 as of June 2026. A third pull from the same site, on a different report page, showed the median at $2,850,000, up only 2%.
Three numbers, three growth rates, one neighborhood, roughly the same window of time. That's not a data error so much as a symptom. Sleepy Hollow only produces a handful of closed sales in any given month, so a single high-dollar estate closing can swing the median by hundreds of thousands of dollars and the year-over-year percentage by double digits. A market this thin doesn't have a stable median. It has a median that moves depending on which two or three houses happened to close last.
Zoom out to the city level and the picture gets stranger still. Redfin's citywide figure for Orinda, also for the three months ending May 2026, put the median sale price at $2.0 million, up 6.5% year over year. Zillow's home value index for the same month put the typical Orinda home value at $2,015,587, down 6% year over year. Two respected sources, same city, same month, opposite direction. The gap exists because a sale-price median tracks whatever actually closed, while a value index estimates every home in the area whether it sold or not. When the mix of what's selling shifts toward larger, pricier properties, as it appears to have in Sleepy Hollow, the closed-sale median climbs even while the estimated value of a typical, unsold home in the same city sits flat or drifts down.
Orinda Downs, a few minutes away, shows the same instability from the opposite side. Redfin's most recent read put its median down 23.1% year over year. Same city, same season, and the two neighborhoods are moving in opposite directions hard enough that averaging them into one "Orinda market" tells you almost nothing useful about either one.
Numbers on a report page are one thing. What happened at the six most recently documented Sleepy Hollow closings tells the real story.
Three of those six sold the day they hit the market. Two sat for over two months. The oft-quoted "homes sell in 7 days" figure does not describe the average for these six sales. Half your sample is zero-day closings, while the other half ranges from 13 to 92 days; an average alone hides that spread.
A zero-day close usually means one of two things: a house that already had a buyer lined up before it ever hit the public listing feed, or a house priced and marketed so precisely to a known pool of interested parties that the offer arrived before the sign went up. Neither looks like a bidding war in the conventional sense. It looks like a deal that happened quietly, then got recorded publicly after the fact.
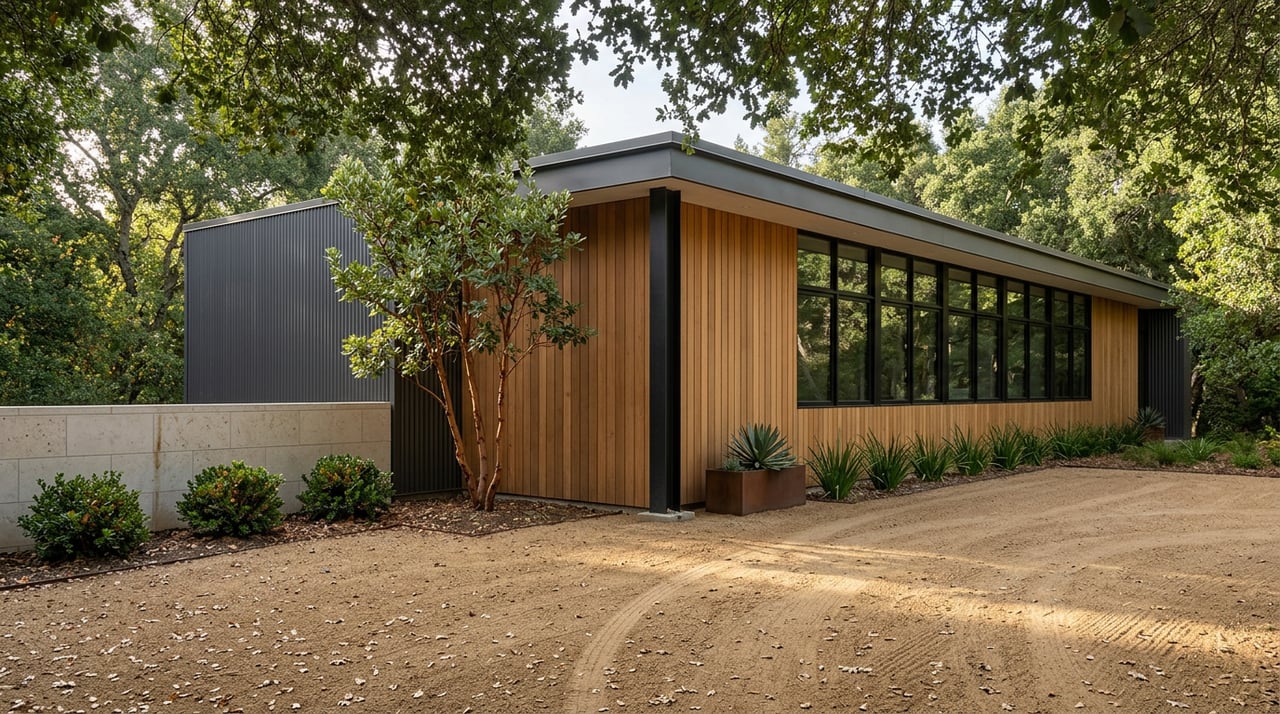
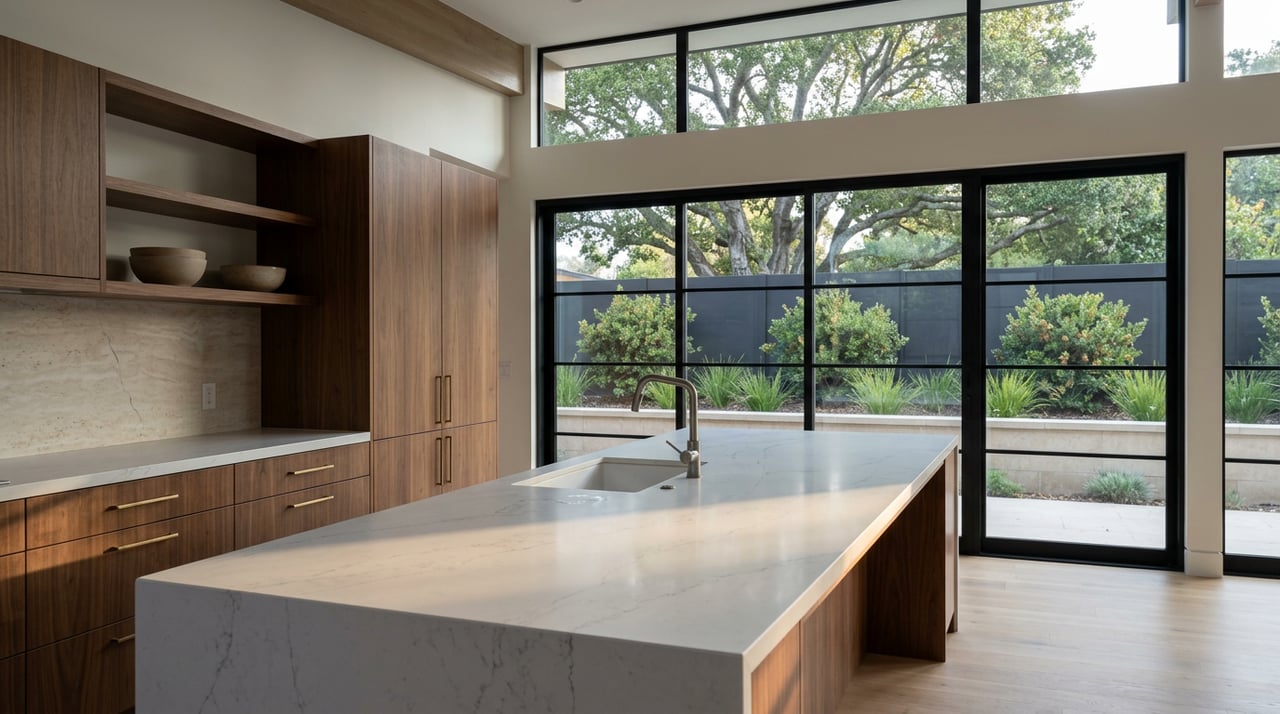
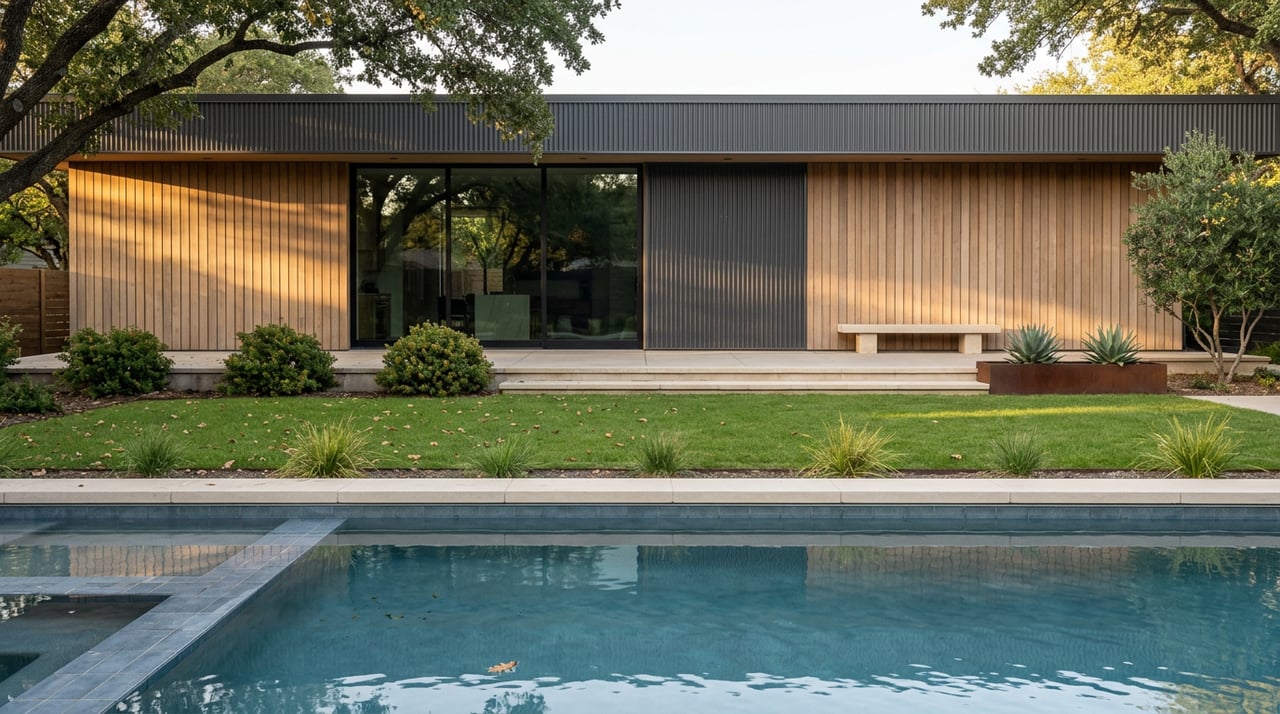
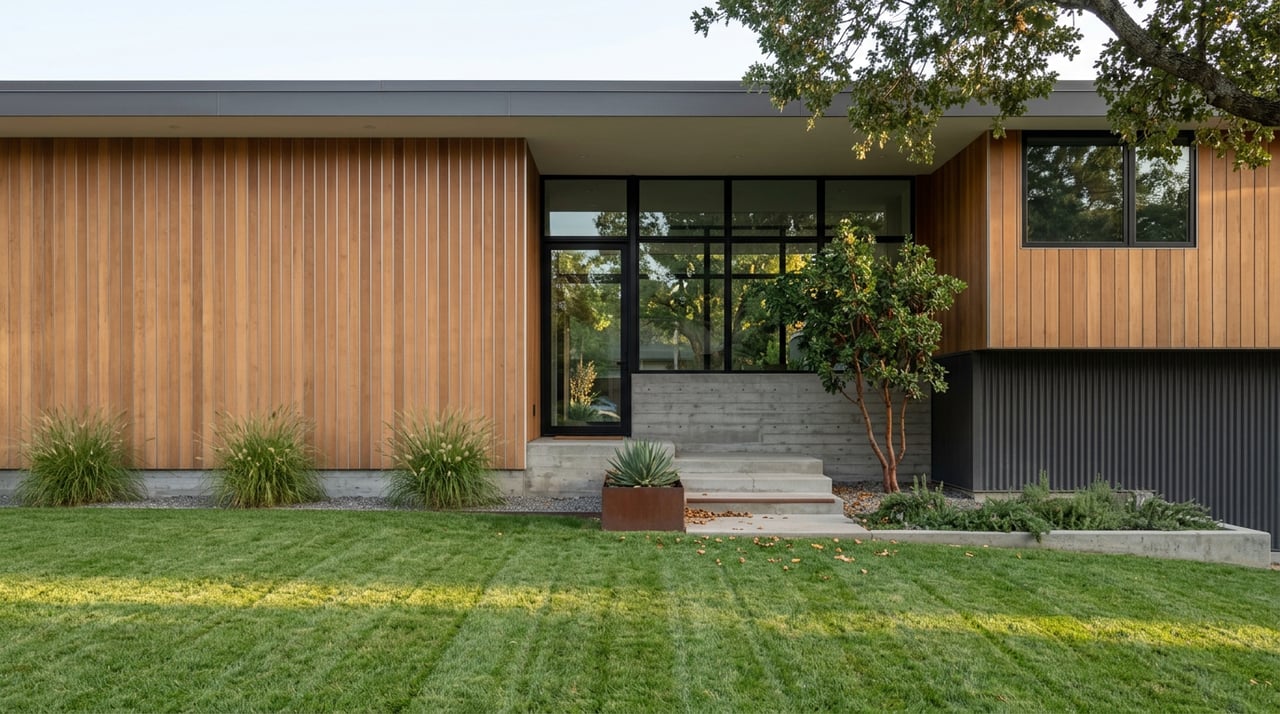
That pattern fits what Shannon Conner, a Village Associates Realtor who lives in Orinda, has said about what actually drives the neighborhood's appeal. A Homes.com local guide quotes her saying Sleepy Hollow is "coveted because the lot sizes are bigger in our area." Several of the neighborhood's more distinctive recent listings reinforce that point directly. More than one Sleepy Hollow property on the market this year credits Bay Area architecture firm EnvelopeAD as the designer, built on half-acre-plus parcels with ridgeline views and glass-heavy contemporary layouts. Houses with that kind of pedigree, on that kind of land, tend to move through relationship networks rather than open showings, because the pool of buyers who want exactly that combination is small and well known to the agents working the area.
Meanwhile, a conventional four-bedroom on a standard lot, even one with real square footage and a good year built, still has to find its buyer the traditional way: listed, shown, compared against similar homes, and negotiated. That's 181 Lombardy Lane's 92 days and 9 Berrybrook Hollow's 69, both selling below or right at asking after the market had time to think it over.
If you're shopping Lamorinda and Sleepy Hollow's median keeps coming up as the hot pick, treat that number as a description of a handful of large, distinctive properties, not a forecast for whatever similarly priced house you're actually considering. The question that matters isn't "what did the neighborhood do this year." It's "what did homes like this one, on lots like this one, actually take to sell."
That means asking for the specific comps, not the neighborhood average. It means asking how long a listing agent expects a particular house to sit based on its lot size and architectural profile, not based on a headline percentage. And it means recognizing that Orinda Downs falling 23.1% and Sleepy Hollow reportedly climbing over 20% in the same season isn't a contradiction to resolve. It's two small, thin markets each getting pulled around by whichever few houses happened to close.
How much is Sleepy Hollow's market reported to be up right now? The reported figures range from 2% to nearly 34% year over year depending on the source and the exact months compared, and all of them come from a market with only a handful of closings per month. The direction is real. The precise size of the gain shifts depending on which few houses closed in the window being measured.
Why do some Sleepy Hollow homes sell in a single day while others take three months? The fastest sales tend to involve larger lots, distinctive architecture, or relationships between agents and buyers that form before a house is publicly listed. Standard homes on standard lots still go through a full, and sometimes slow, public marketing process.
How does Sleepy Hollow compare to Orinda Downs or Wagner Ranch right now? Not favorably as a like-for-like comparison using medians alone. Orinda Downs posted a 23.1% year-over-year decline in the same recent period Sleepy Hollow was reportedly surging. The two neighborhoods are small enough that a handful of transactions can move each one's numbers independently, which is exactly why a house-by-house comparison serves buyers better than a neighborhood-wide statistic.
If you're weighing Sleepy Hollow against another Lamorinda neighborhood, or trying to figure out what a specific lot size and architectural profile is actually worth in this market, that's the conversation worth having before you fall for a headline number. Alexis Thompson has spent nearly two decades working these streets and can walk you through the real comps, not just the average. Get a free home valuation and find out what your Sleepy Hollow property's actual market position looks like.
Stay up to date on the latest real estate trends.
Etiam non quam lacus suspendisse faucibus interdum. Orci ac auctor augue mauris augue neque. Bibendum at varius vel pharetra. Viverra orci sagittis eu volutpat.